WinePulse in Action: Key Takeaways from Free Training Friday
.png)
In our recent Free Training Friday, Britney Yunker, Education Specialist at Commerce7, and Remy Sabiani, Founder of WinePulse and Head of Insights at Commerce7, teamed up to demystify WinePulse. They highlighted the highest-impact dashboards and reports, plus a handful of quick tips to help you navigate faster and get more value out of your reporting.
Why WinePulse?
Commerce7 already includes robust reporting, but WinePulse expands what’s possible with 90+ prebuilt reports and nine mobile-friendly dashboards that go deeper into KPIs and insights, all refreshed nightly from your Commerce7 data.
WinePulse is now available to all live Commerce7 clients, from Lite through Enterprise, accessible in a single click directly within Commerce7. One click launches you into your fully synced reporting environment.
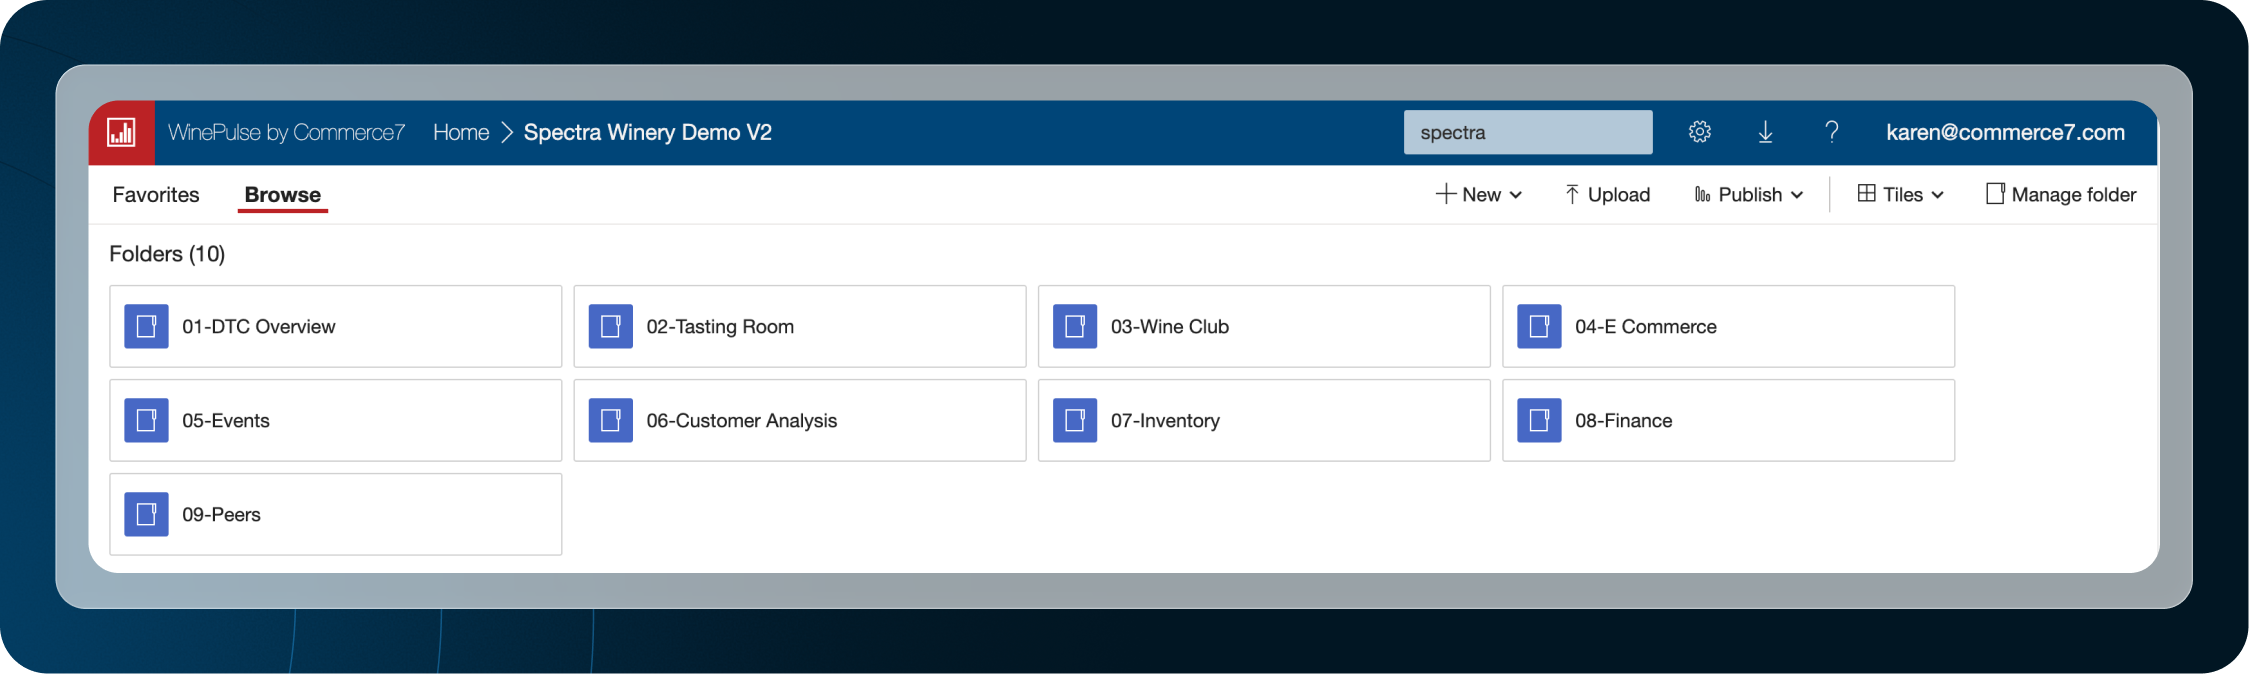
The Architecture
Britney described Wine Pulse as an onion; as you click into folders (or "buckets"), layers of more specific data open up:
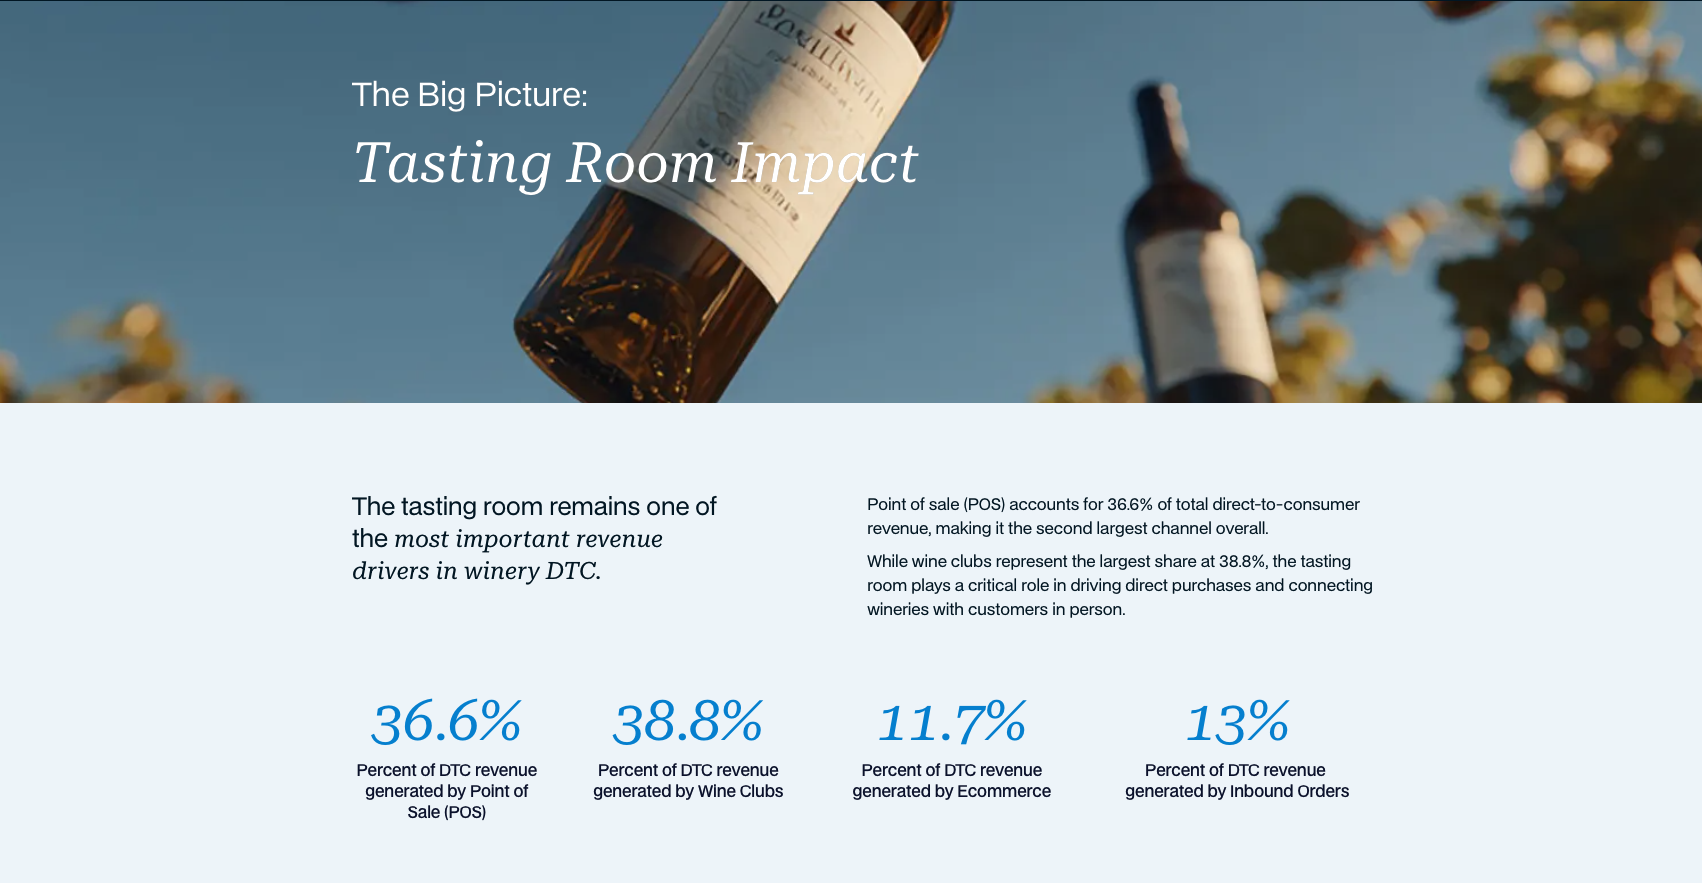
- The Main Folders: Nine top-level categories ranging from Tasting Room Analytics to Wine Club Analysis.
- Dashboards vs. Reports: Dashboards are highly visual, "at-a-glance" snapshots perfect for mobile use. Reports offer granular, downloadable data for deeper analysis.
- Timing: Data flows into Wine Pulse nightly, meaning most reports reflect data as of yesterday. The only exception is the Daily Live Dashboard, which shows real-time data.
Dashboard Highlights
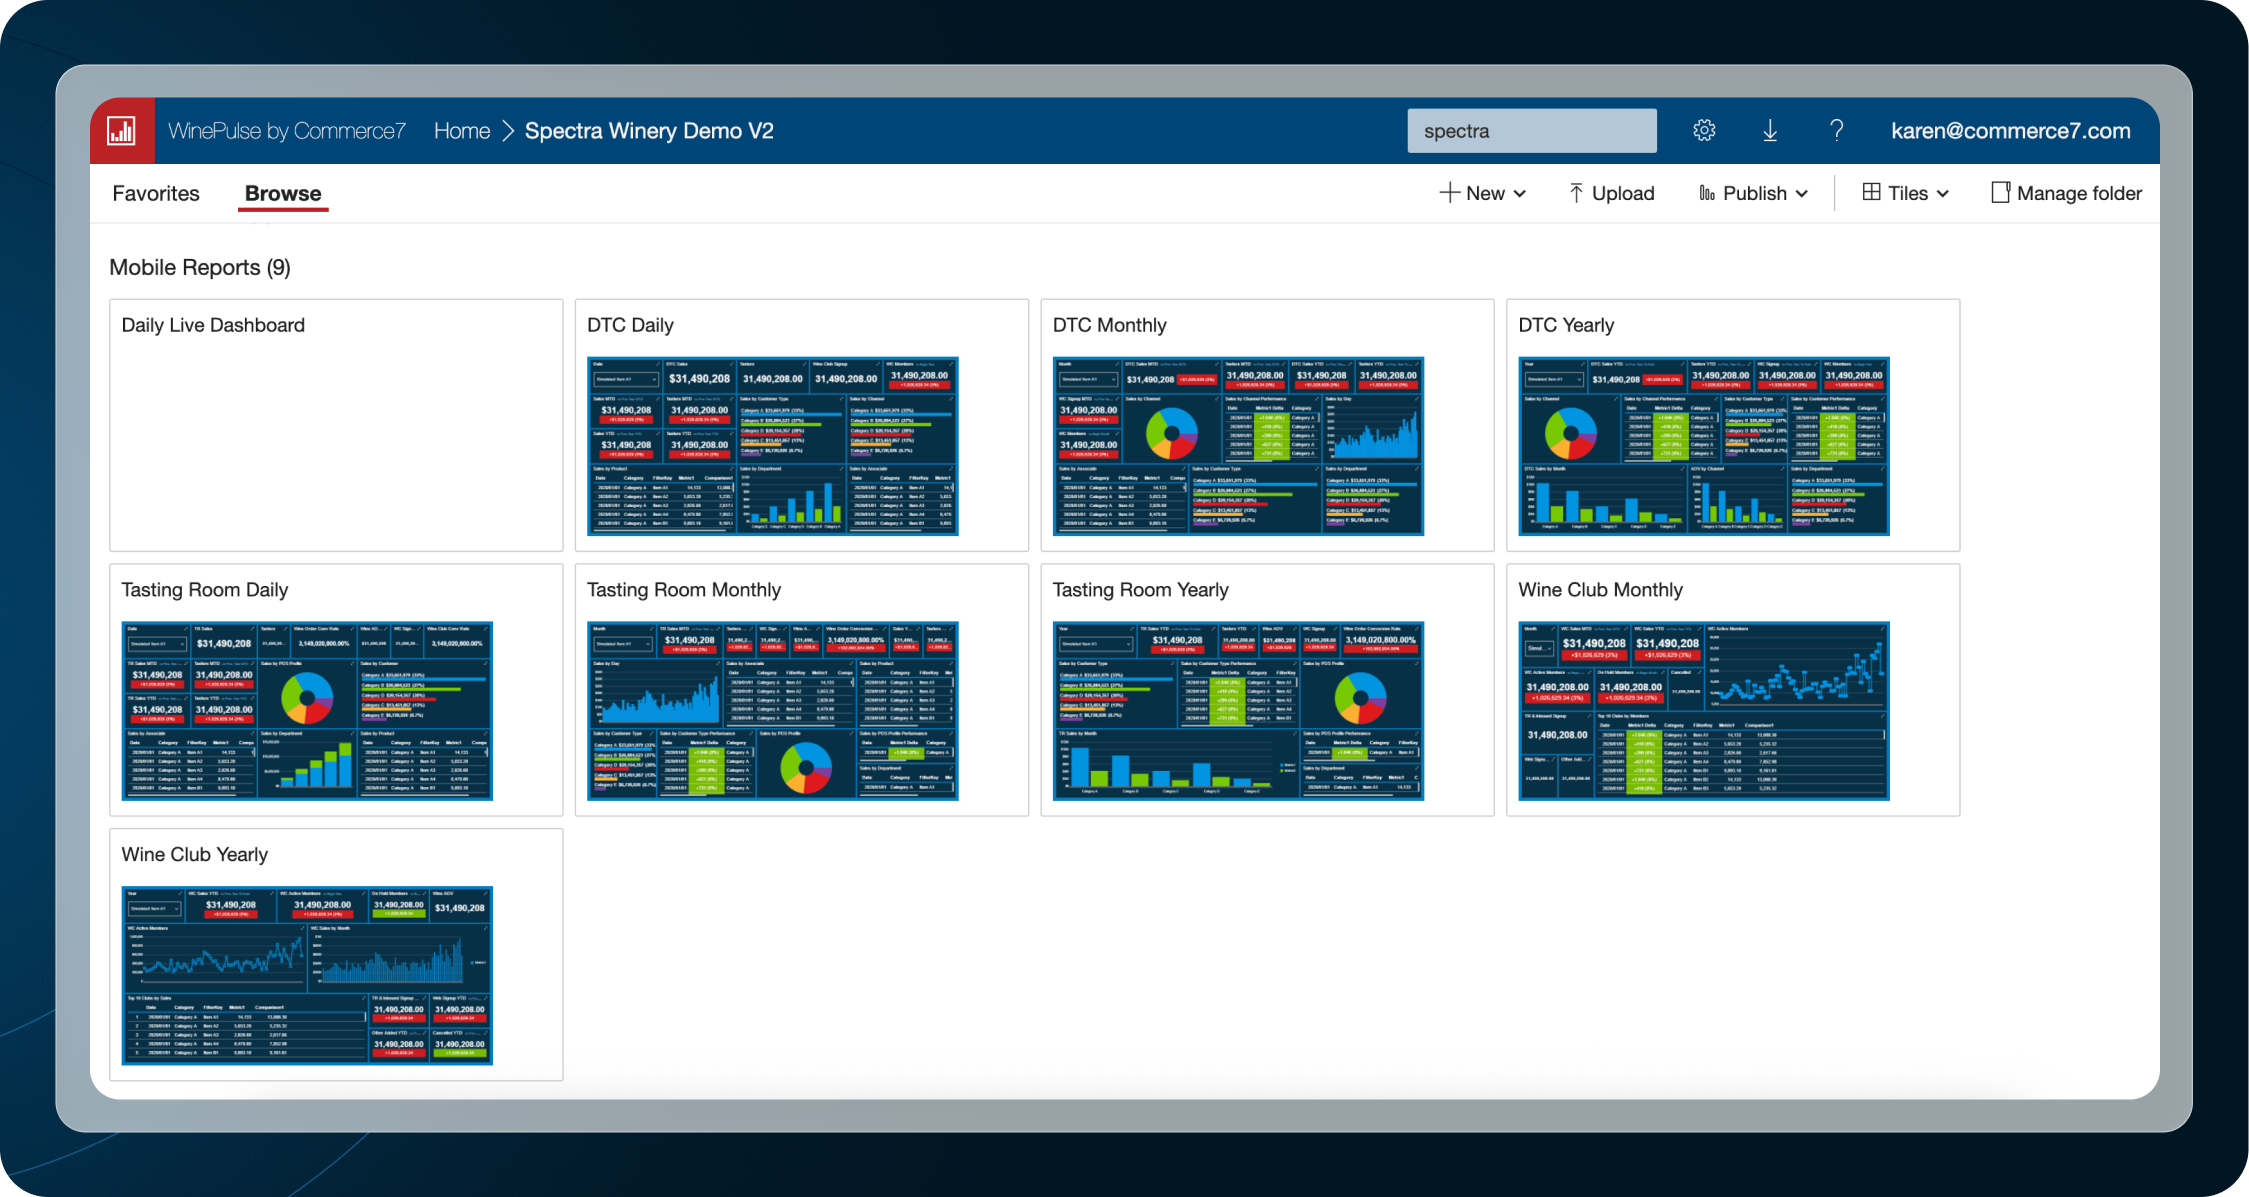
We spotlighted three key dashboards that every winery should be using:
DTC Daily: A visual breakdown of yesterday’s sales, including year-over-year comparisons (green for "better," red for "not quite there yet").
- This allows you to immediately see if you are hitting your marks compared to the same day last year. Visual cues (green for "up," red for "down") help you identify performance trends at a glance without digging through spreadsheets.
Tasting Room Monthly: A deep dive into the current month’s sales by day, associate performance, and product sales.
- This helps managers track progress toward monthly goals and understand which products or staff members are driving the most revenue in the tasting room.
Club Yearly: A look at active vs. on-hold members and where your signups are coming from (Web vs. Tasting Room).
- It provides a macro-view of your club's health, showing you exactly where you started the year versus where you are now, helping you strategize for growth.
"Must-Have" Reports
Sales Associate Performance: Track total sales, wine club signups, and even tips by individual team members.
- Use this data to incentivize your team, identify coaching opportunities, and reward your top performers based on concrete metrics like signup conversion and total revenue.
Wine Club Attrition: Calculate your true attrition rate by distinguishing between actual cancellations and "switches" (moving from one club to another).
- By separating "switches" from "true cancellations," you get a more accurate picture of member loyalty and can better understand if members are leaving entirely or just looking for a different club tier.
Sales by Region: A powerful marketing tool that allows you to filter customers by zip code and distance.
- This is perfect for geo-targeted marketing. If you’re hosting a winemaker dinner or a local pickup party, you can pull a list of customers within a 50-mile radius to ensure your marketing spend reaches the most relevant audience.
Automate Your Morning: Email Subscriptions
Stop hunting for data and let it come to you. You can set up any report to be emailed to your team (or external partners like accountants) on any cadence—hourly, daily, or monthly.
Pro Tip: We recommend activating the DTC Daily Overview (sent every morning) and the Wine Club Snapshot (sent every Monday) to keep your finger on the pulse of the business.
Watch the Recording + Explore WinePulse
If you missed the session or want to revisit specific reports, you can watch the full Free Training Friday recording here.
.png)
.png)
.png)
.png)
.png)
.png)
.png)


.png)
.avif)


Pour yourself a glass of insight.